2021 Census Data from the ONS:
Thanet Ward Data – Census 2021
The data downloaded from the 2021 Census splits the data by Ward. As Thanet consists of 24 wards that also splits Birchington into two sections (Birchington North and Birchington South). So, to see Birchington as a whole the wards have been combined in the following manner:
| Electoral Ward | Area |
| Birchington North | Birchington |
| Birchington South | Birchington |
| Bradstowe | Broadstairs |
| Viking (Thanet) | Broadstairs |
| Beacon Road | Margate |
| Cliftonville East | Margate |
| Cliftonville West | Margate |
| Dane Valley (Thanet) | Margate |
| Margate Central | Margate |
| Salmestone | Margate |
| Westbrook (Thanet) | Margate |
| Central Harbour | Ramsgate |
| Cliffsend and Pegwell | Ramsgate |
| Eastcliff (Thanet) | Ramsgate |
| Nethercourt | Ramsgate |
| Newington (Thanet) | Ramsgate |
| Northwood (Thanet) | Ramsgate |
| Sir Moses Montefiore | Ramsgate |
| Kingsgate | St Peters |
| St Peters (Thanet) | St Peters |
| Thanet Villages | Villages |
| Garlinge | Westgate |
| Westgate-on-Sea | Westgate |
Disability Proportions by Main Area
| Area | Population | Not Disabled | Disabled | % Not Disabled | % Disabled |
| Birchington | 10393 | 7819 | 2574 | 75% | 25% |
| Broadstairs | 11226 | 8859 | 2367 | 79% | 21% |
| Margate | 45408 | 34642 | 10766 | 76% | 24% |
| Ramsgate | 43781 | 33699 | 10082 | 77% | 23% |
| St Peters | 9216 | 7319 | 1897 | 79% | 21% |
| Villages | 8055 | 6496 | 1559 | 81% | 19% |
| Westgate | 12505 | 9617 | 2888 | 77% | 23% |
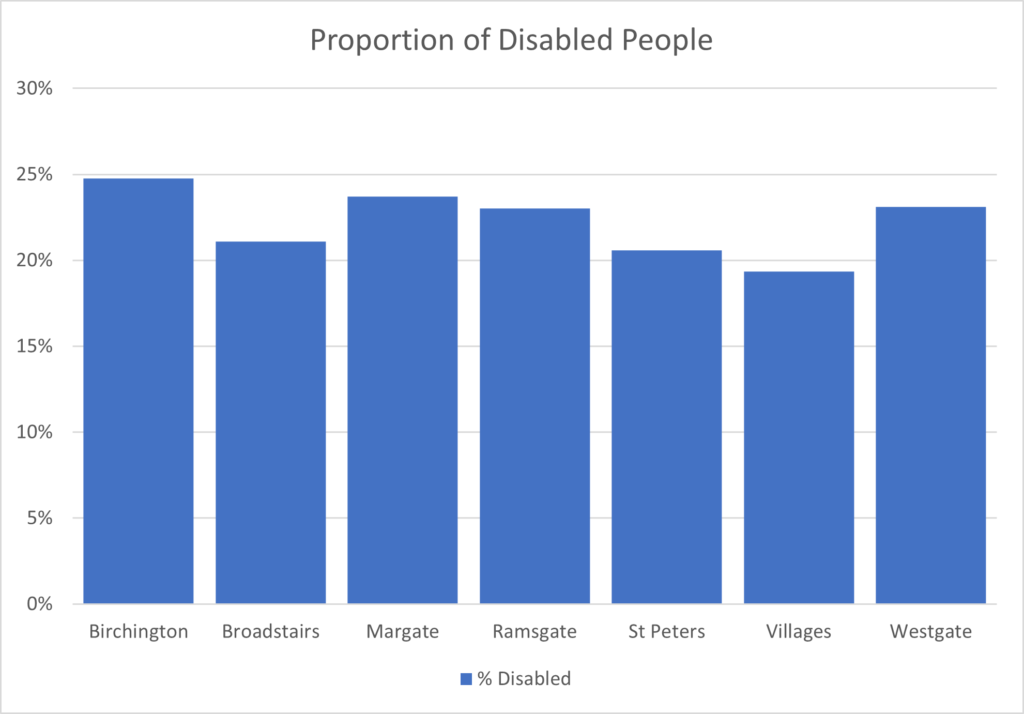
As you can see from the graph on the left Birchington has the highest proportion of disabled people in Thanet.
“Birchington is full of old people and that’s why”
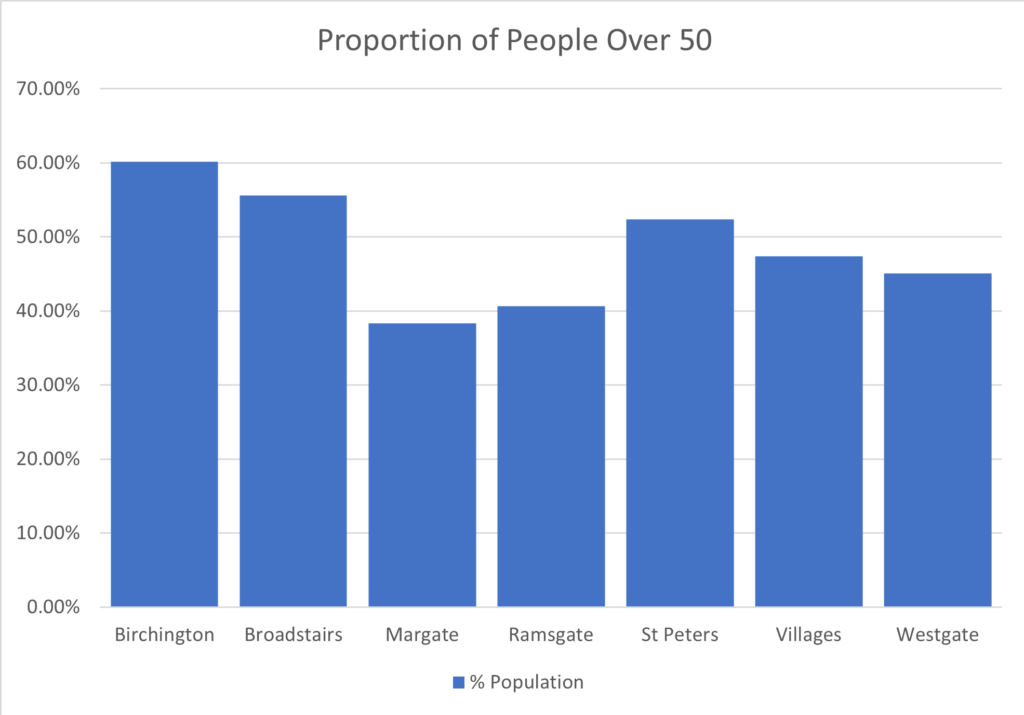
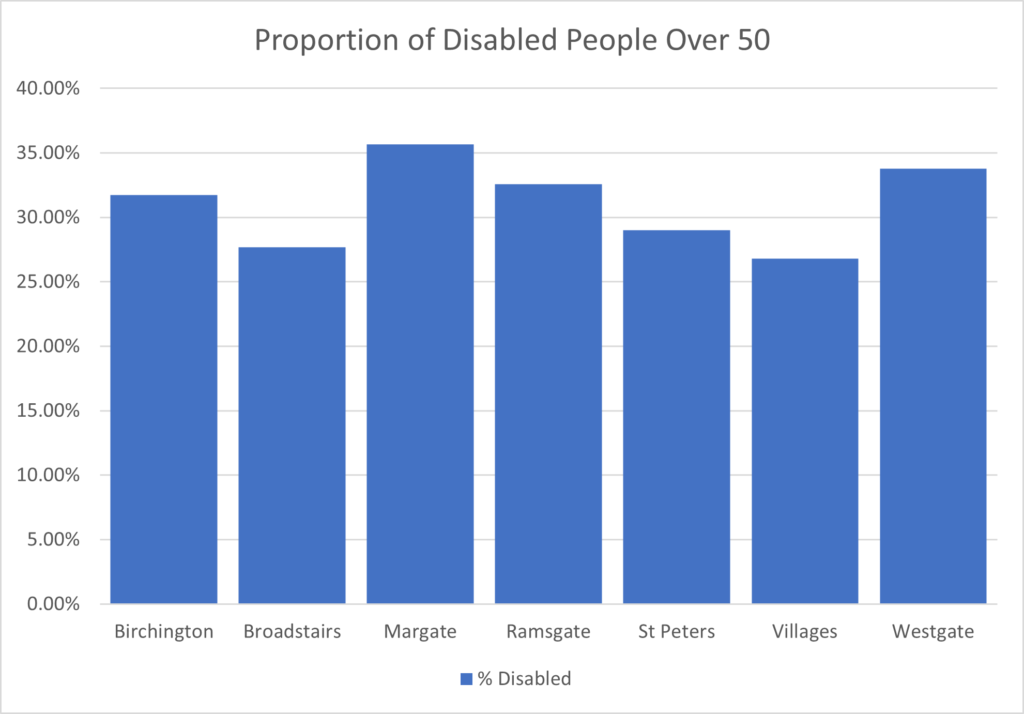
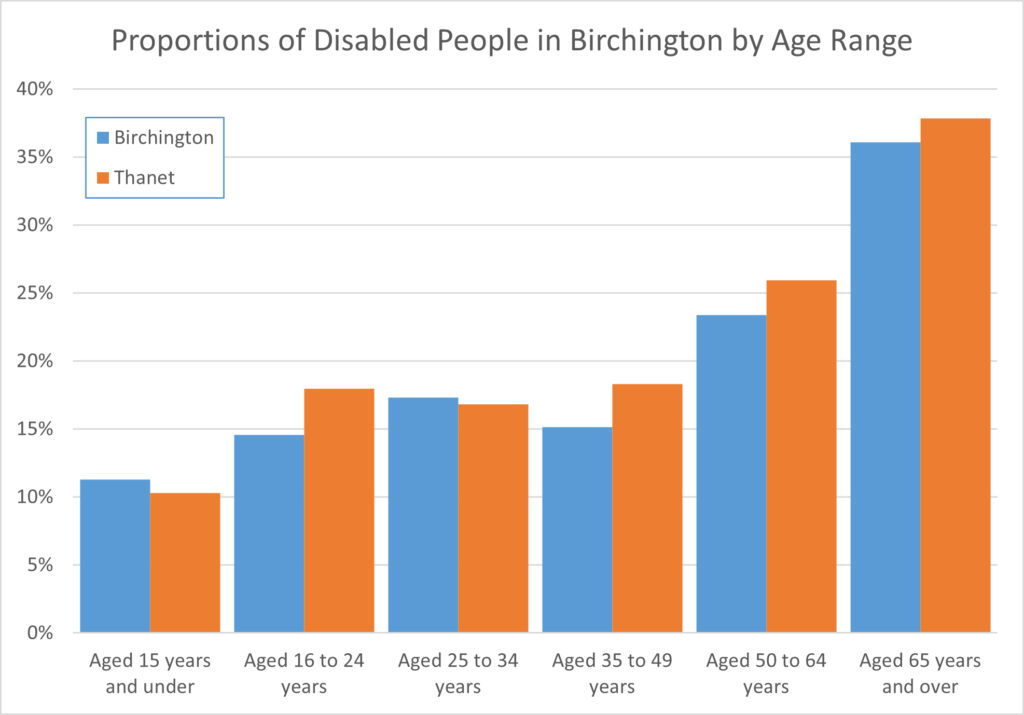
Not true. Birchington does indeed have the most elderly population, but does not have the largest disability proportion in the over 50s age group:
Proportion of Disabled People in Birchington by Age Range
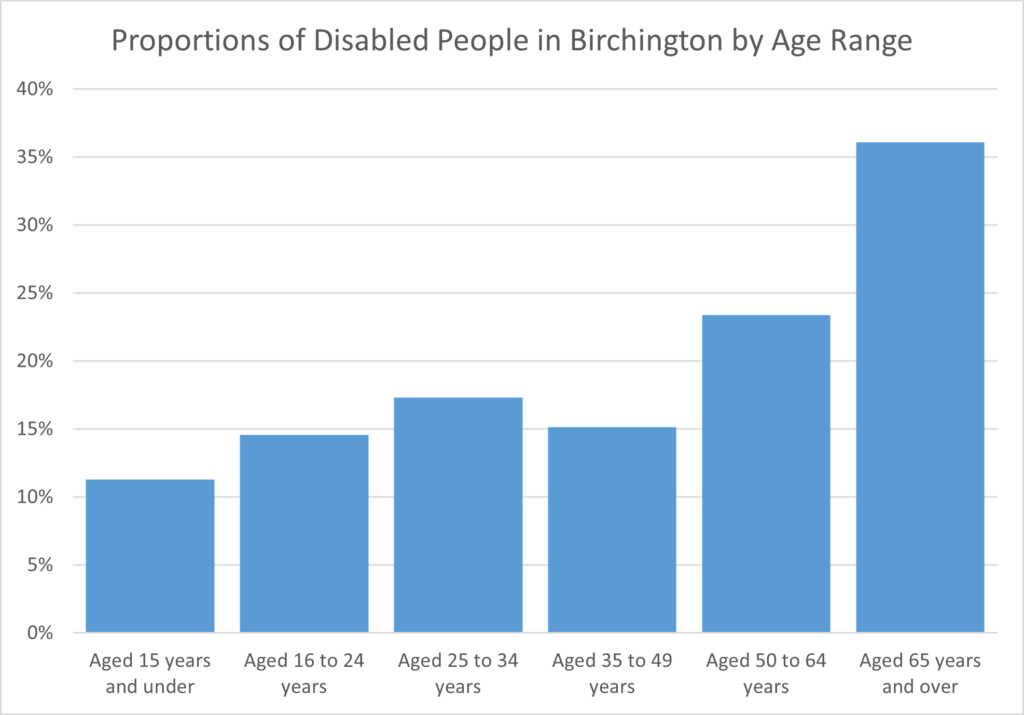
Unsurprisingly, the proportion of disabled people is directly proportional to age and is in keeping with Thanet as a whole.
Page Views:
867